
Build beautiful charts and data visualizations with ease.
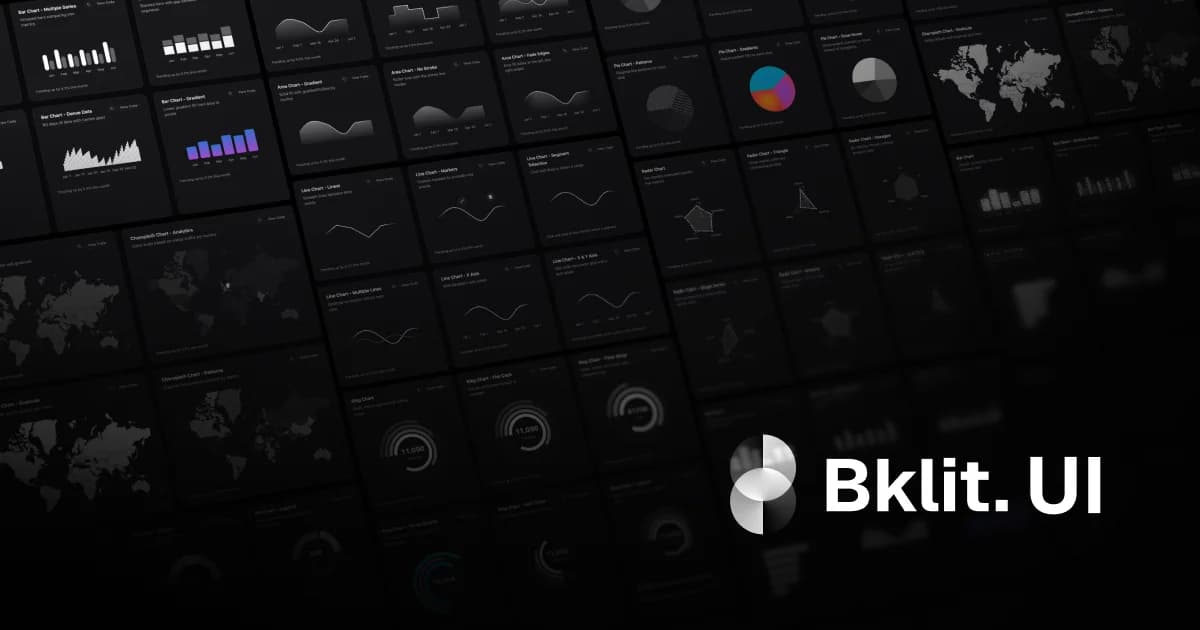
Bklit UI is a React component library for creating sophisticated charts and data visualizations. What it does: Built on top of shadcn/ui, Bklit UI provides pre-built, customizable components designed to simplify the integration of complex charting functionalities into your web applications. It leverages modern React patterns and accessibility best practices to ensure your data is presented clearly and effectively. Key features: • Chart Components — A suite of ready-to-use chart types including line, bar, pie, and scatter plots, allowing for rapid development of visual data representations. • Shadcn/ui Integration — Seamlessly integrates with shadcn/ui, inheriting its design system and accessibility features for a consistent user experience. • Customization Options — Offers extensive props and styling capabilities to tailor charts to your specific brand guidelines and data requirements. • Data Visualization Tools — Provides tools to transform raw data into insightful visual narratives, aiding in better data comprehension. • React-Based — Developed with React, ensuring compatibility with modern frontend development workflows and ecosystems. Use cases: • Building interactive dashboards for business intelligence platforms. • Creating financial charts for investment tracking applications. • Visualizing user engagement metrics in analytics tools. • Displaying scientific data in research and development portals. • Generating reports with clear graphical representations of key performance indicators. What makes it different: Bklit UI uniquely combines the power and flexibility of shadcn/ui with a specialized focus on data visualization components, offering a streamlined path to creating professional-grade charts without extensive custom coding.


